
APECS Polar Week 2018, Day Two, Polar Number: Percentages
Welcome to part 2 of our humble quest to provide you with our #PolarNumbers!
Today, I want to share some Arctic #PolarNumbers with you (and since today’s challenge is percentages, I of course hid some % in our Arctic numbers):
- 6*10⁶ km²: So much of the Arctic Ocean is covered by sea ice in summer, corresponding to 18365 cities of Bremen
- 15*10⁶ km²: So much of the Arctic Ocean is covered by sea ice in winter, corresponding to 45914 cities of Bremen
-
11%: That’s how much the all-year sea extent declined between 1979 and 2010 (not even including the last years where itdropped even faster). Each year’s minimum sea ice extent since 2002 has been beneath the average between 1981 and 2010

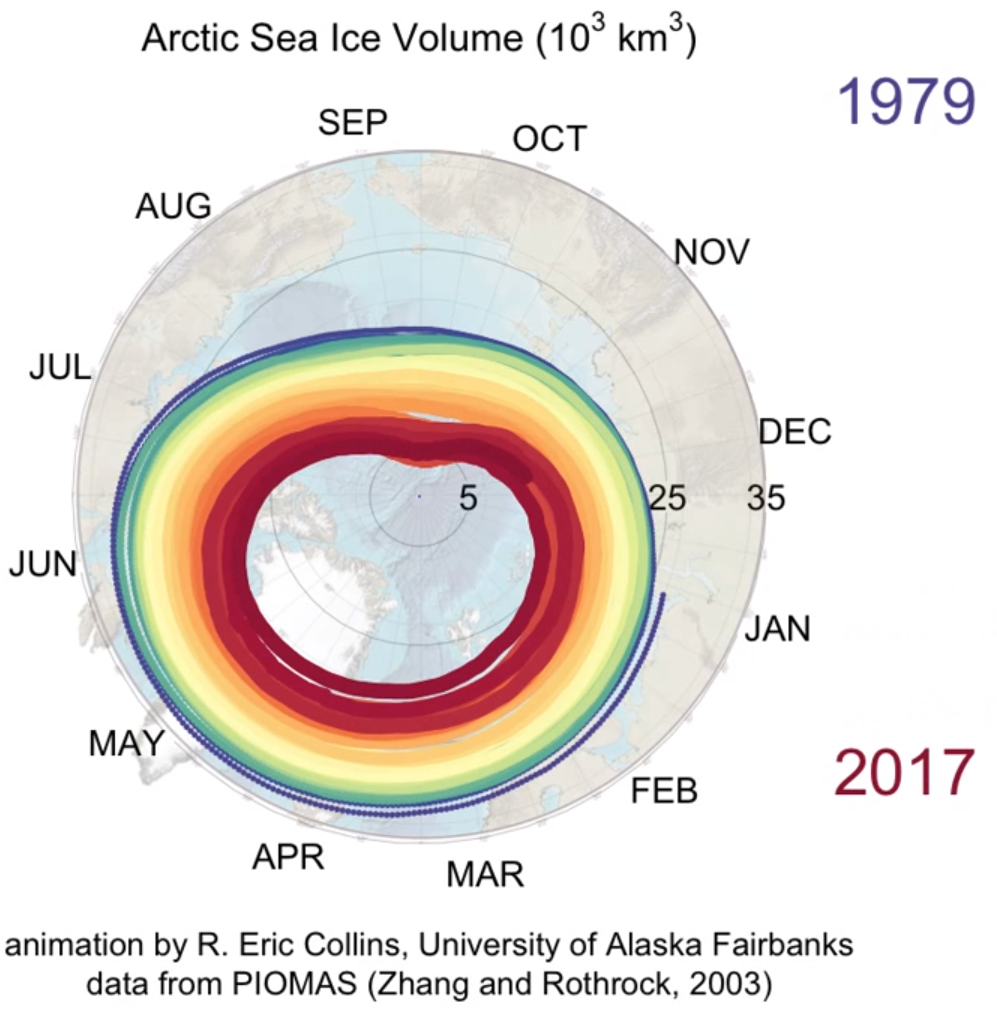
Decrease of Arctic sea ice volume between 1979 and 2017. Watch the entire video here: https://www.youtube.com/watch?v=6sbBxECIKxs
- 1.30 m: Mean sea ice thickness in autumn
- 2 m: Average sea ice thickness in summer
- 1.5 m: Sea ice thickness decline (conservative estimate) between 1978 and 2008 (again, not even including the recent years…)
- 40%: Sea ice volume in 2017, compared to the average between 1979 and 2017 (watch this video for an impressive animation of sea ice volume decrease)
- 40%: Time a vessel saves by taking the Northeastern Passage rather than the Suez Channel for the highly frequented route Rotterdam-Yokohama
- 11: Number of wildfires north of the Arctic Circle ( North of 66°N) that have been reported this year
- 6.2°C: Temperature measured at the northernmost tip of Greenland on February 22nd
…but yeah, climate change is absolutely a Chinese invention, no doubt about that.