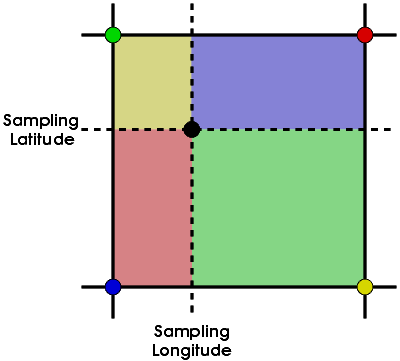
WOA-Sample

A tool to interpolate the 10 m World Ocean Atlas (1998) temperatures to a set of given locations, intended for the calibration of paleo-temperature reconstructions within the MARGO programme.

Input: List of sampling longitudes (left column) and latitudes (right column), expressed as decimal degrees, positive east- and westward.

Example:

   -23.4 22.9
    10 50
    10.1 41.2


Please, give one location per line and delimit longitude and latitude only by white space (at least one blank or tab).

Output: Table of the input locations plus six additional columns representing the annual and seasonal 10 m temperature means and the number of WOA data included in the average.

Example:

      Lon     Lat    Annual  J-F-M   A-M-J   J-A-S   O-N-D  N
    -23.400  22.900  22.539  20.907  21.630  23.846  23.775 4
     10.000  50.000 -99.000 -99.000 -99.000 -99.000 -99.000 0
     10.100  41.200  17.836  13.745  16.982  22.888  17.728 2


A zero in the last column indicates that no WOA data were available for the given sampling location. In this case, the temperatures are flagged by a value of -99.000.


Enter your data here: You may type in directly or paste from clipboard.   


Averaging Method:

The temperature samples are computed as the area-weighted average of the four WOA temperature points surrounding the sample location:

    T × Area + T × Area + T × Area + T × Area
T = -----------------------------------------
            Area + Area + Area + Area


WOA data points marked as land are omitted from the averaging. If, for example, the southeastern point is missing, T is calculated as:

    T × Area + T × Area + T × Area
T = ------------------------------
          Area + Area + Area

Interpolation Scheme


Contact: mailto Christian Schäfer-Neth   Andreas Manschke   October 2002